MarketBrowser Tutorial #9 -
mSheet™ Investments Spreadsheet - A Live Market Spreadsheet
One extremely unique and extraordinary MarketBrowser AE feature, is its ability to handle NOT ONLY custom live charts which flow continuosly over time BUT ALSO to isolate and calculate individual data points from data contained in your dynamic market charts and analytics.
In other words, you can spot trends and apply your own custom analytics and technical studies to your charts, while pulling current values of
complex calculations into a spreadsheet style display. Your mSheet is a live market spreadsheet that is computationally aware of the data in your live MarketBrowser
charts, and updates instantly in conjunction with changes in your live and custom computed charts.
What a Simple mSheet Can Do
Scroll down this page as we go through the step by step instructions for putting together a simple example of an mSheet.
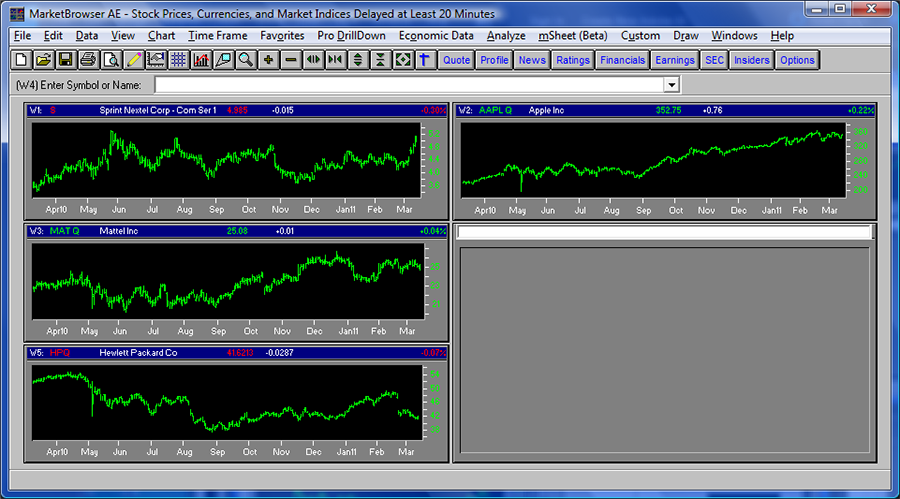
1. Set Up Your Charts: In the image below, we start off with 4 stocks charted (keep in mind, you can chart up to 100 stocks per worksheet in MarketBrowser AE). Here we've picked Sprint, Apple, Mattel, & Hewlett Packard.
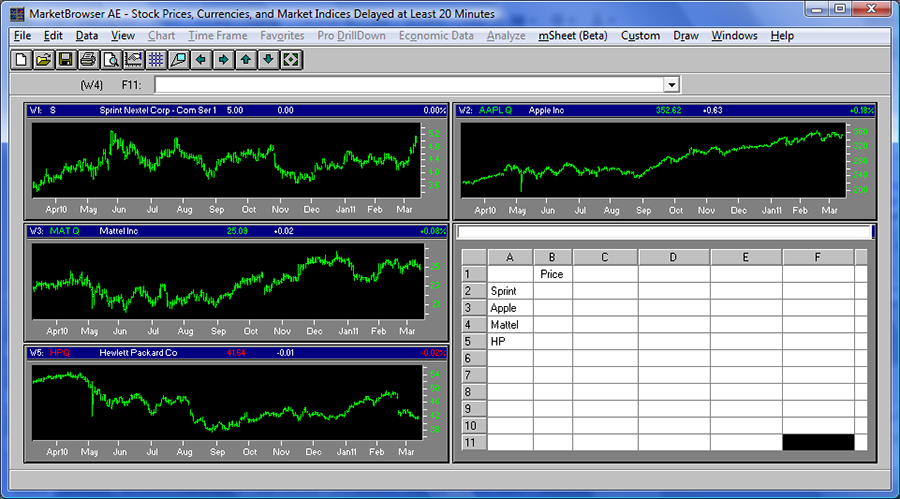
2. Set Up Your mSheet: Select a Clear Window, then go to the menu bar and click 'mSheet'-->'New Sheet'. Your mSheet appears in the Window. Next, set up your sheet by selecting individual cells and typing in the names of your stocks, as well as a column title of "Price".
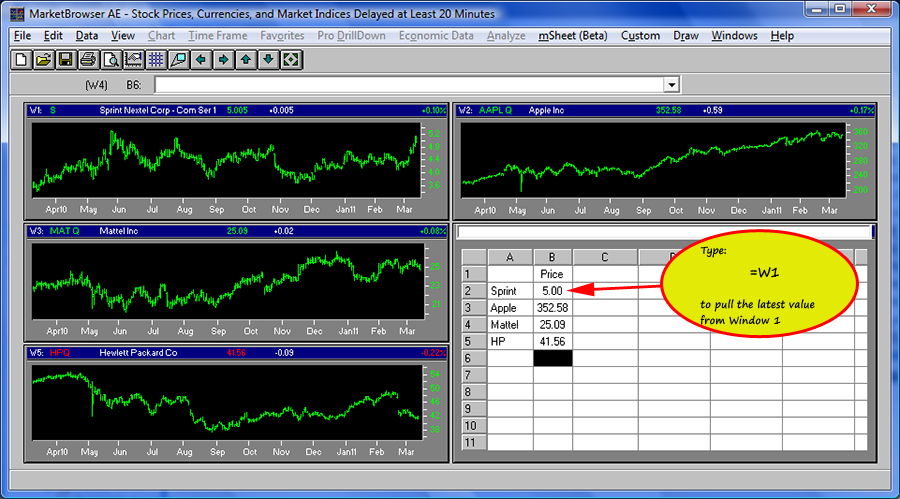
3. Create Your Price Watchlist: Enter the formula =W1 into a cell. Presto! The latest value in Window 1 will display in your watchlist. This is a live cell, which means it will watch Window 1 and update automatically as W1 brings in new values, or even if you change the symbol in W1!
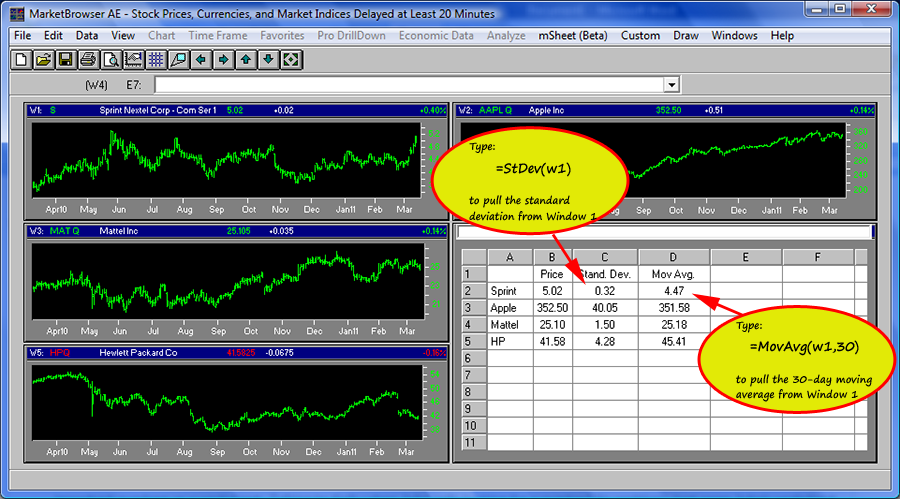
4. Add Standard Deviation & 30-Day Moving Average to Your Watchlist: Enter the formula =StDev(w1) to pull a live standard deviation calculation from Window 1. To add a current value for its 30-Day Moving Average, type: =MovAvg(w1,30)
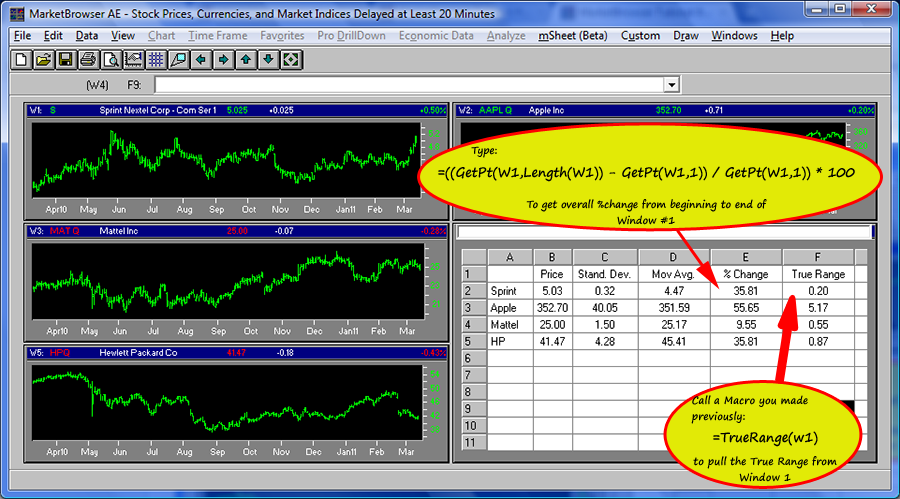
5. Build Your Own Formulas & Use Them in Your mSheet MarketBrowser is supremely powerful because it empowers you to build and use your own formulas. In the image below, we've created our own formulas. The first calculates the % change for the entire chart. We entered the following formula into the mSheet:
=((GetPt(W1,Length(W1)) - GetPt(W1,1)) / GetPt(W1,1)) * 100
(we won't explain the formula here, but see Tutorial #5 for more information about building your own formulas). Then in the final column we used a custom macro that we had built previously called =TrueRange to calculate window #1's true range! (Learn more about building complex formulas using Macros here).
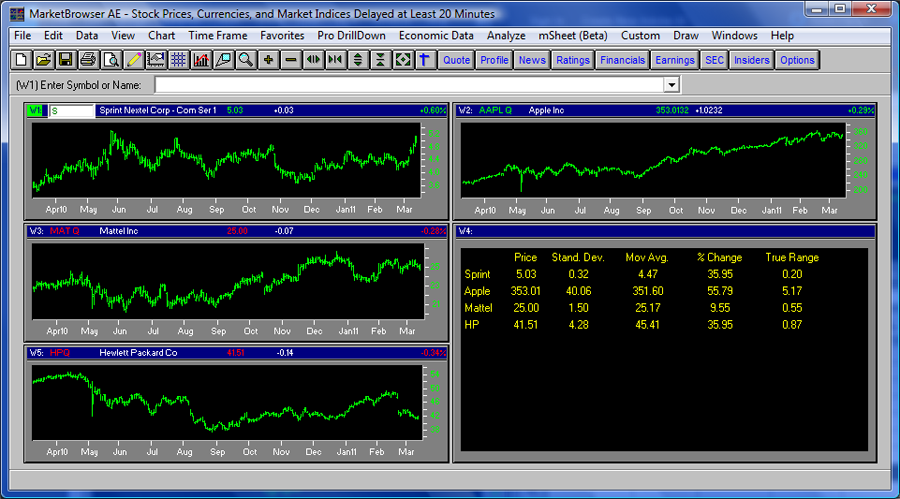
6. Flip 'Sheet View' to Yellow on Black Display: Now that our edits are done, we want to switch the mSheet to a display mode. By going to the 'mSheet' menu and selecting 'Sheet Views' we can flip the mSheet into a mode that's best suited for a display WatchList. Now sit back and watch as the live calculations update as the live charts they're based upon update!
Thank you for reading...
We hope you have enjoyed this MarketBrowser AE tutorial. If you have suggestions or topics you would like to see, please contact us.
Welcome to the MarketBrowser family!
Warmest Regards,
The MarketBrowser Team
PS. Please help us improve these tutorials!
Take 3 minutes to tell us what you thought...
| 


